The DNA of our city is complex and clearly borrowed from the sciences. As someone who trained as an architect, I’m very interested in understanding the DNA in terms of the physical infrastructure. However, the DNA for me also deals with the soul of the city: what does the city actually speak about? What are its values? Let me talk first about the physical infrastructure.
There is no doubt that those of us who were brought up in Europe will recognise that in many cities, people living relatively close together in relatively compact environments have the ability to meet, see, exchange with others, exchange goods, ideas and conversations in a relatively unplanned manner.
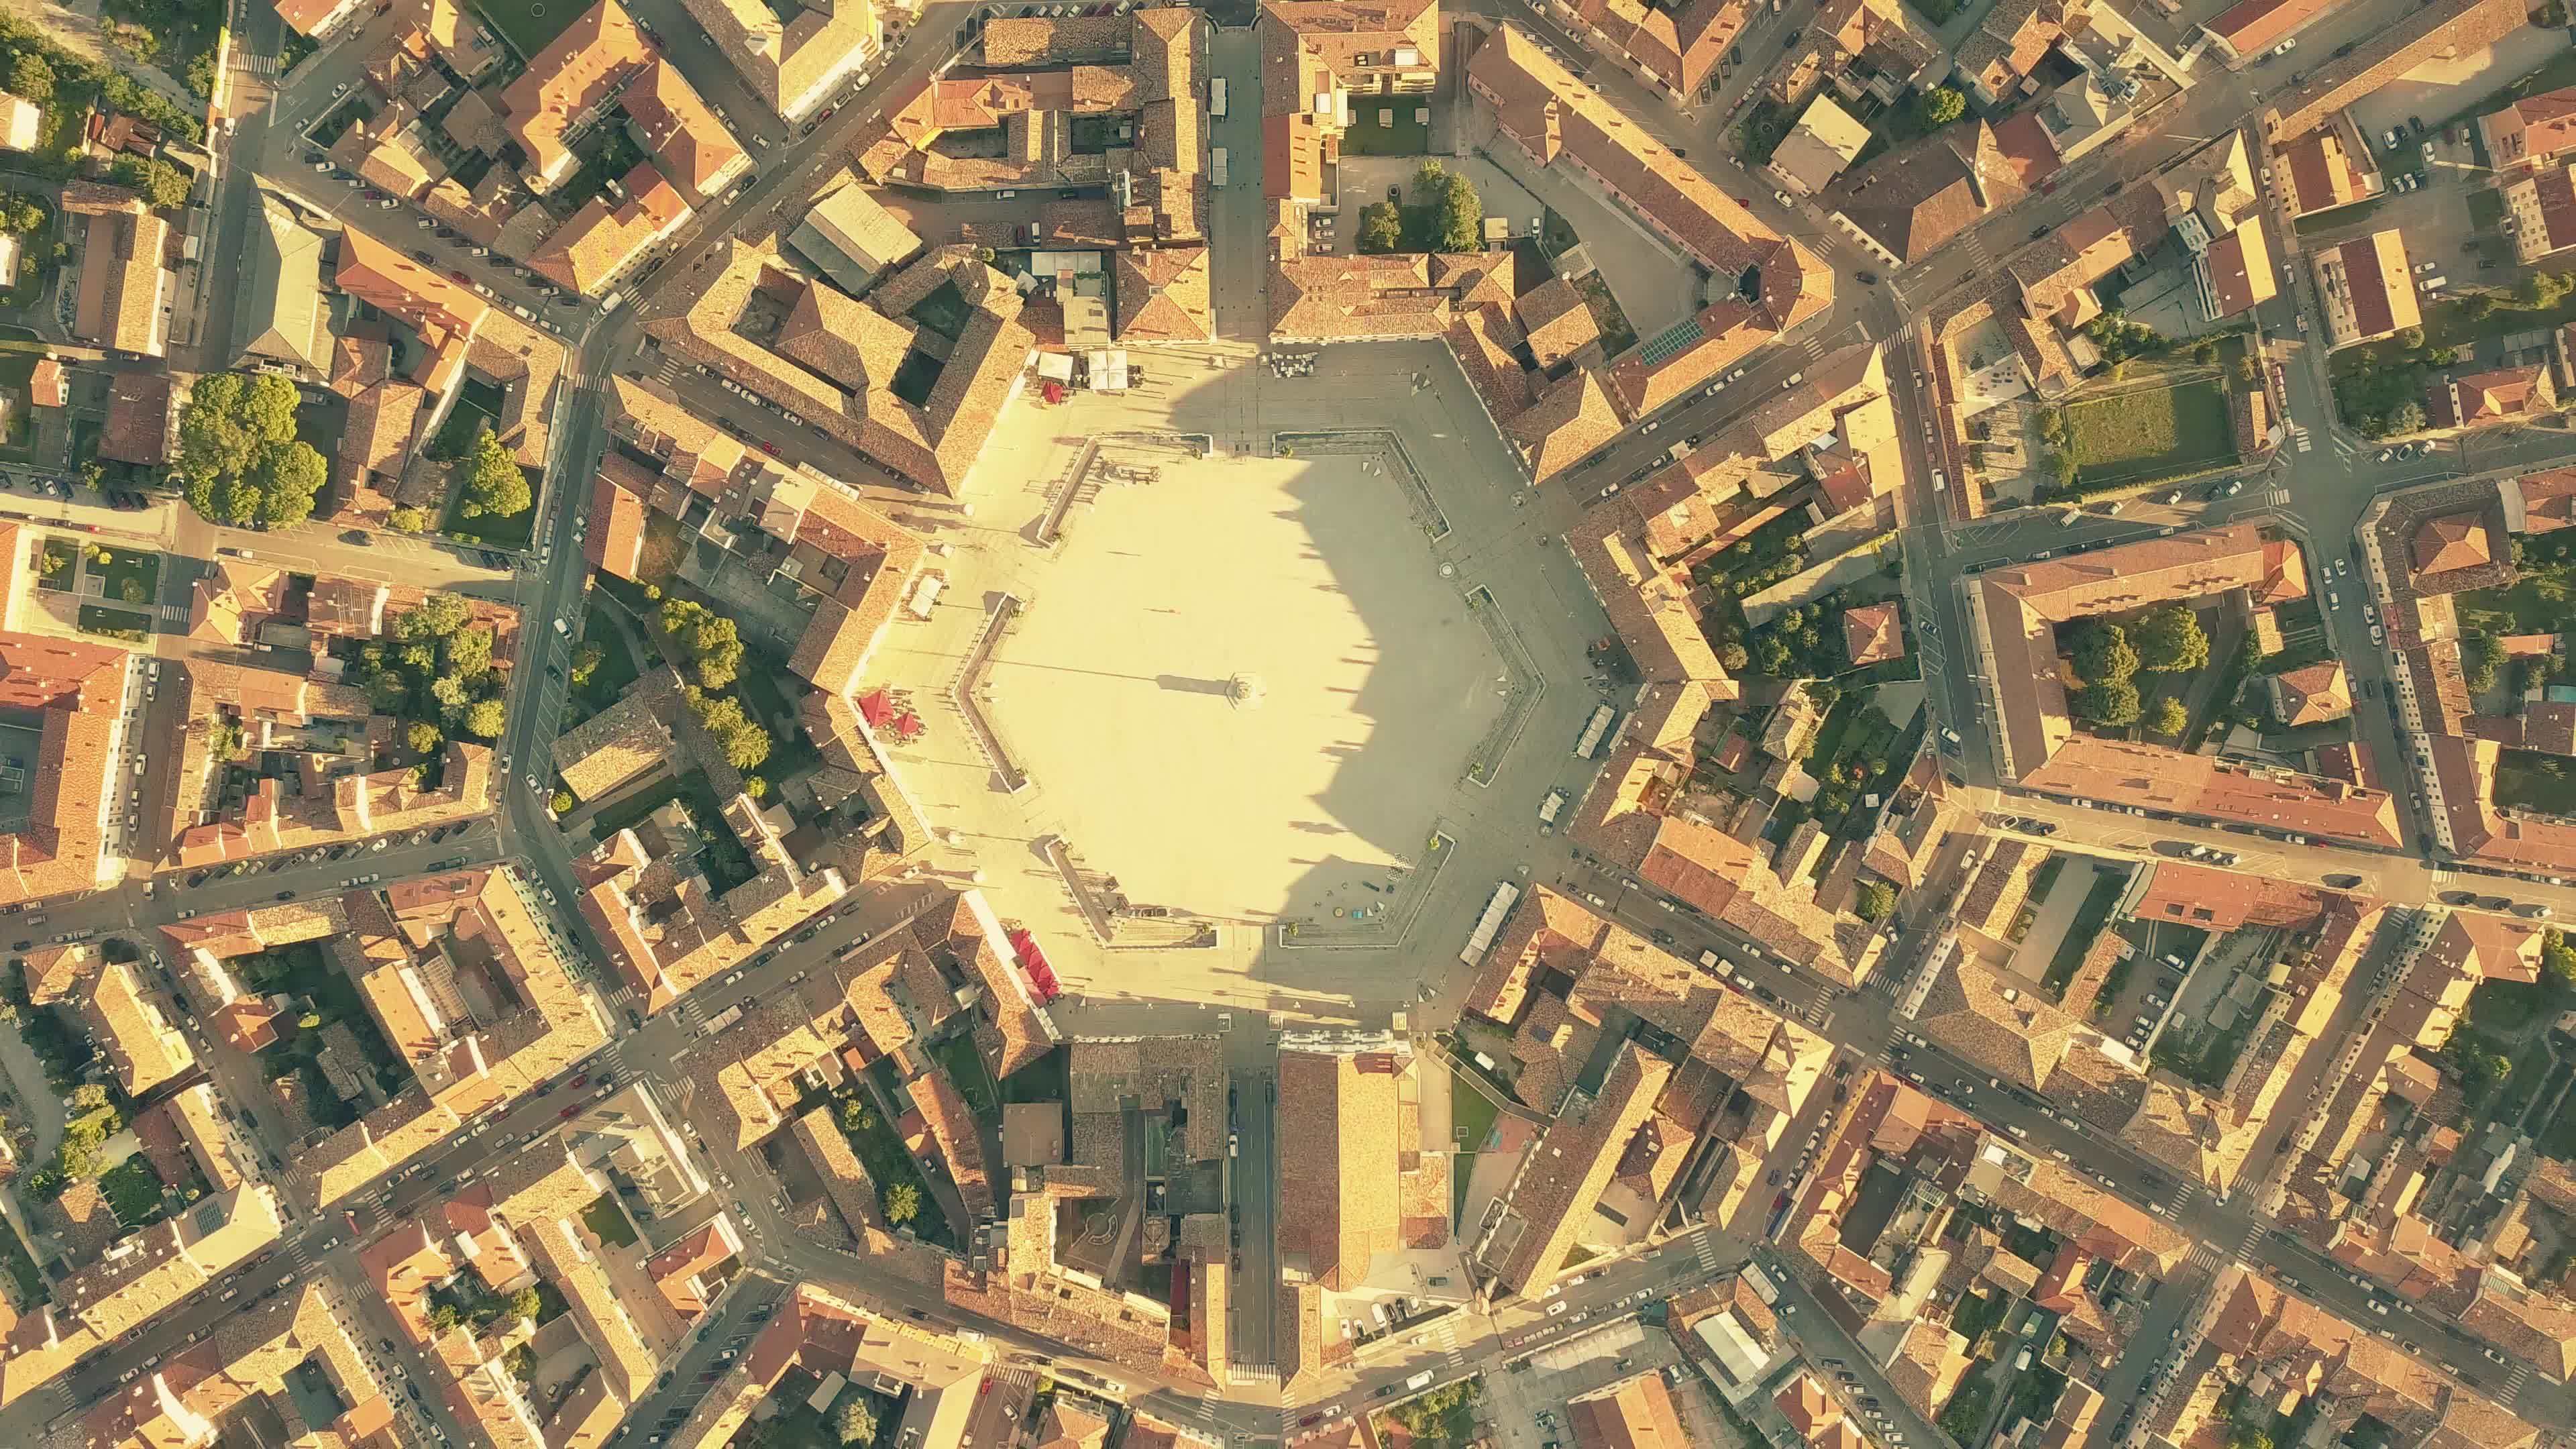
Of course, exactly those relationships between the physical DNA of a city – the presence of a street, a narrow alleyway, a sudden unexpected square with maybe a little bar or shop next to it, and then the ability to look another way, down a larger avenue towards the river – that is the physical infrastructure, the DNA of a city. That can apply to a well-planned city like Washington, DC or New Delhi, or the more organic small villages and towns, which then grow into bigger cities around the world.
The Nolli Plan
There’s an extraordinary map drawn in the 1760s of Rome as it was then, in many ways its heyday, by Giambattista Nolli. He wanted to document what Rome felt like, so he drew all the buildings in black and all the open spaces in white. It’s called the Nolli Plan. This Nolli Plan is a diagram of connectivity in a city, like the fabric of a body: the veins, the nerves and everything that connects it. Even if you don’t know this map – and I describe it in a few words in the case of Rome, but it could be Barcelona or elsewhere – all the white bits interconnect. You can go down a passageway and suddenly find yourself in a place that is slightly inward-looking. Then you turn somewhere else and you come to a tree-lined avenue, and the rest of the city opens up. It’s the relationship between these intimate spaces and grander spaces which I think is what the DNA of a city is about, and DNAs will be all different. The DNA of Beijing, of course, is quite different to the DNA of Hong Kong, and the same applies to different cities in similar geographic regions.
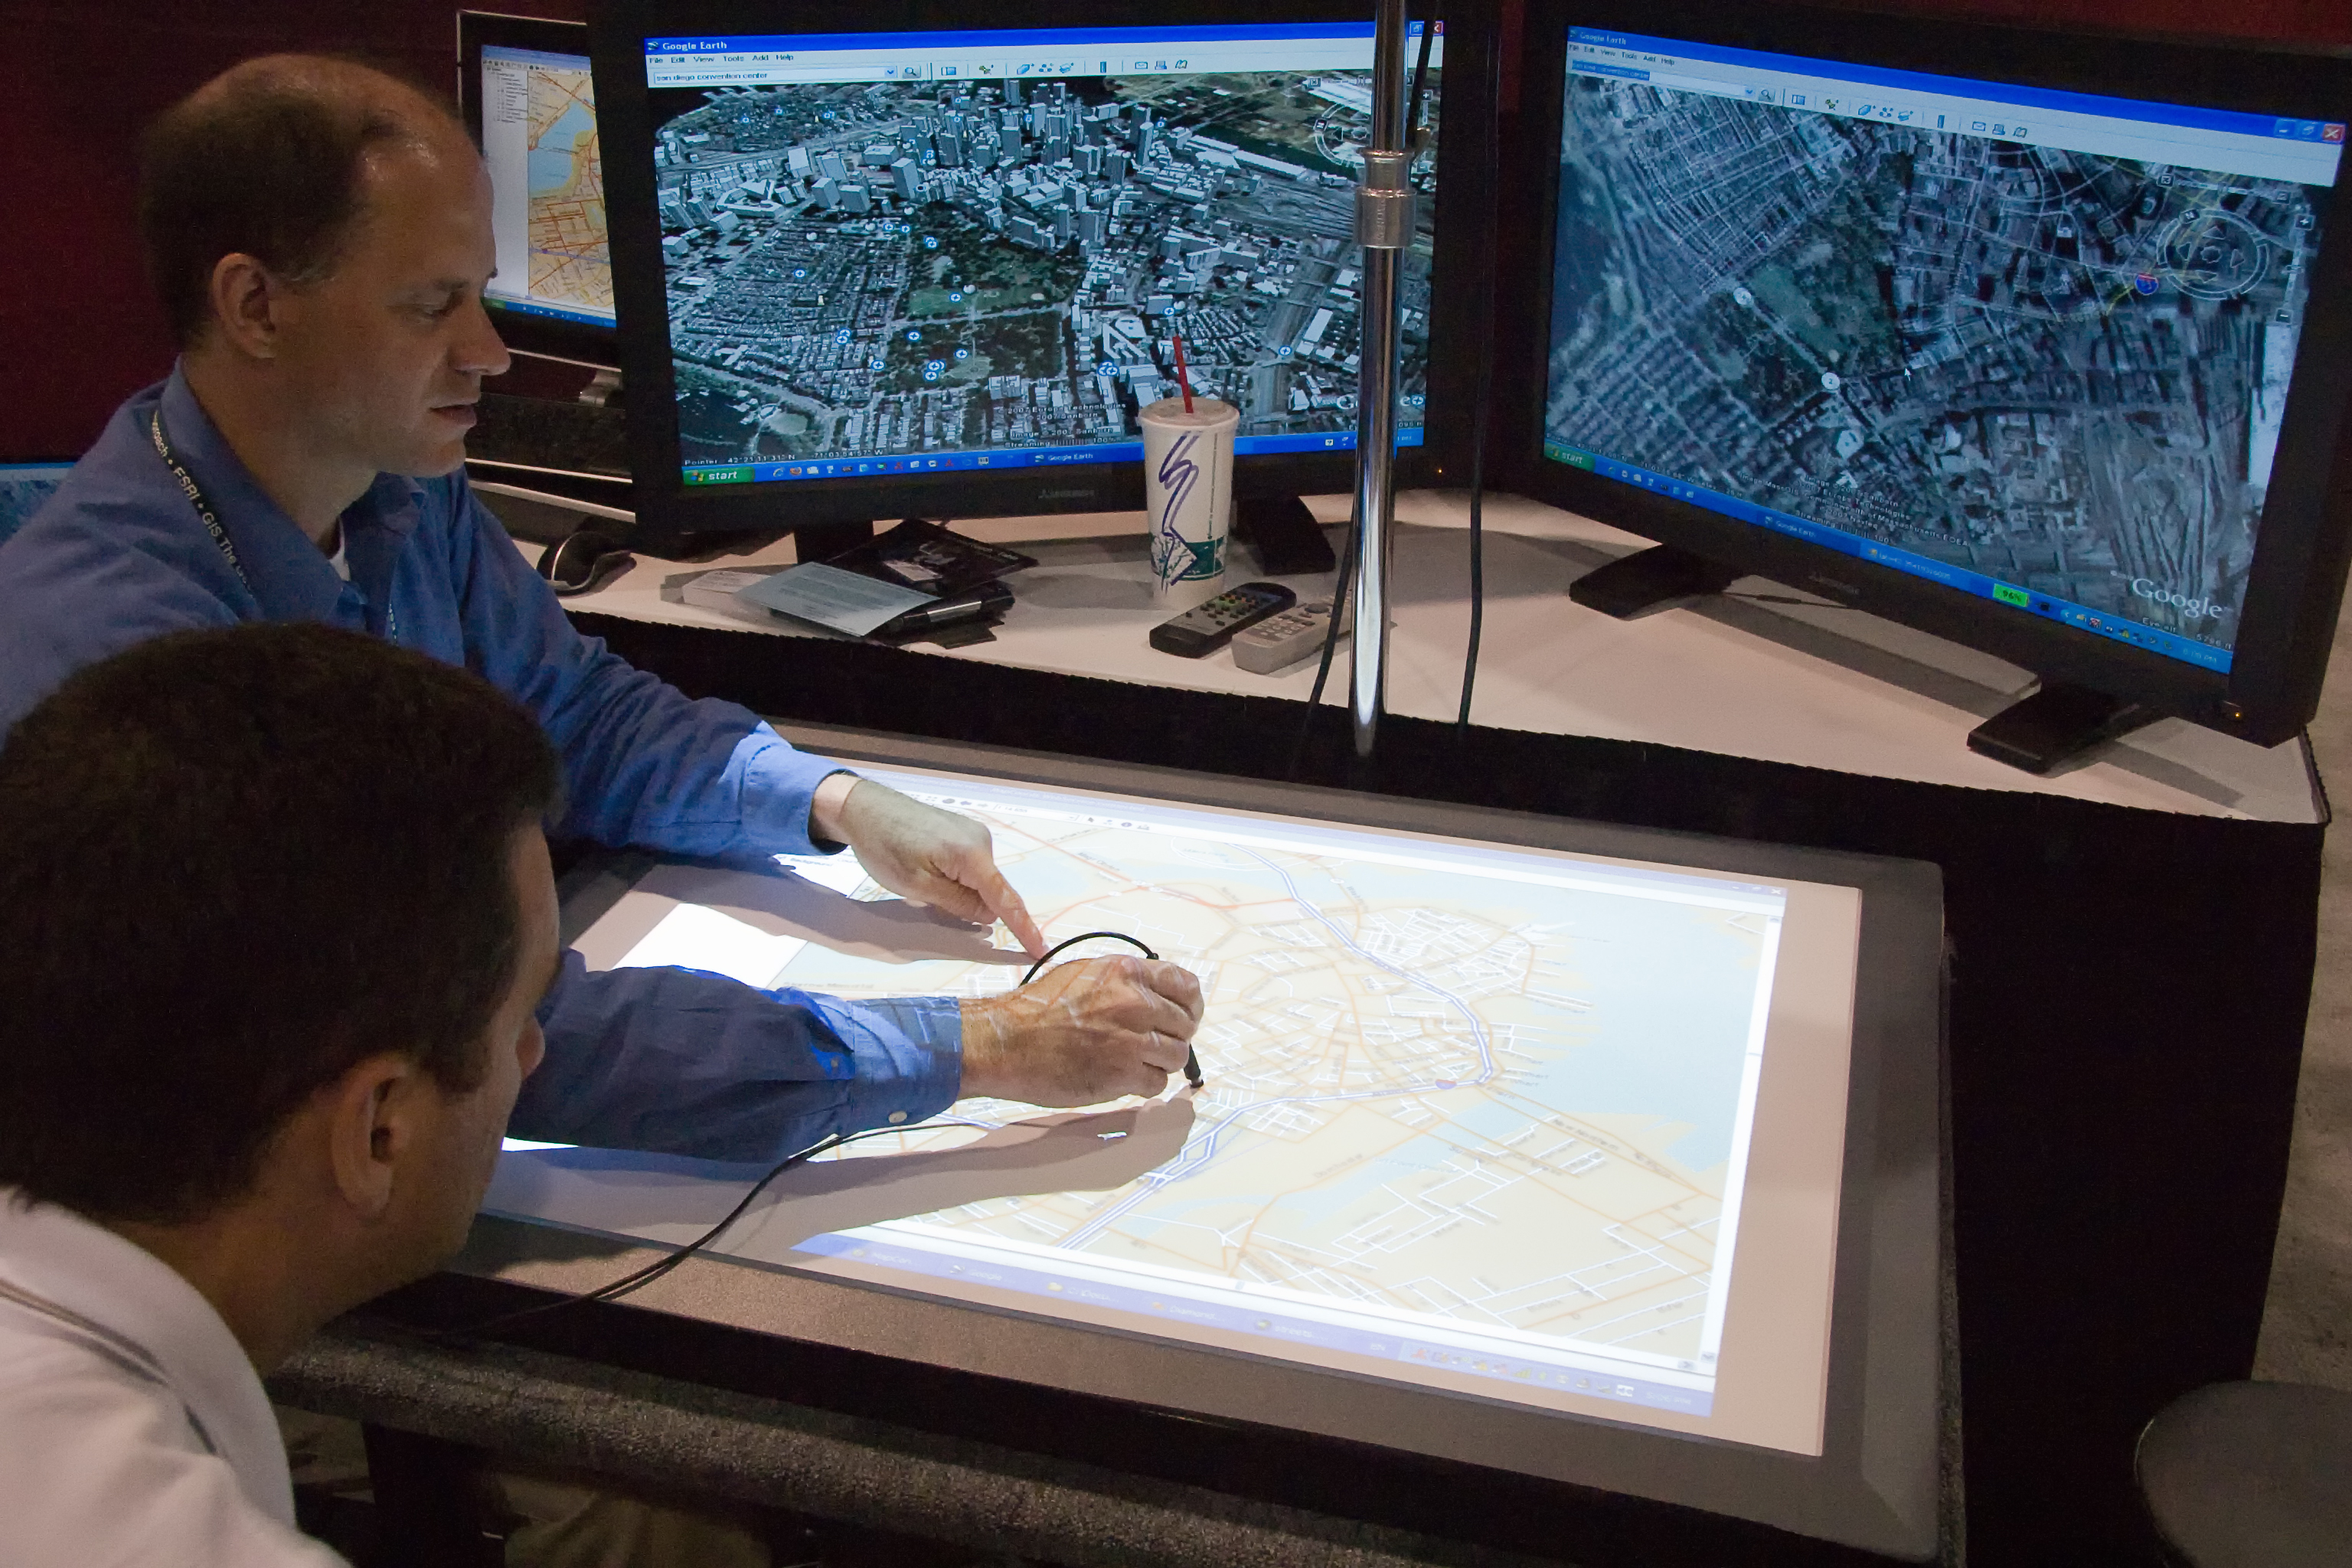
It’s how the physical structure and the social structure actually fit together that constitutes the cultural DNA of the city. Now, scholars, planners and sociologists are interested in these issues and sometimes have the tools to describe them through drawings and mapping, and, of course, current forms of GIS technology allow us to understand that. Yet, it’s how we as individuals inhabit the city and use these different spaces, that is what gives it its complexity and richness. The American urban sociologist Richard Sennett talks about the importance of complexity and multi-layeredness, the fact that the city is always indeterminant. It’s not a complete project, and I think that’s a very important aspect to capture of what makes a city a successful living organism. Too many planners of my generation, but also 50, 100 years ago, envisage cities as perfectly drawn organisms where all the streets are lined up, where all the trees are matched up and look exactly the same, where people and cars behave in regular patterns. Of course, that’s not how things are, and in many ways the richness of cities allows for that complexity. Most 21st or even 20th century planning has been about the reduction of complexity, simplification and making the urban experience more generic, more anaesthetic – and without that soul, which is at the heart of the DNA of a city.
Adapt and change
The way you preserve the DNA of a city is by first understanding it; you’ve got to be able to read it, to describe it. You’ve got to be able to talk to the people who inhabit it in certain ways and understand how it works. As a planner and architect, the way you can preserve the DNA is not by keeping everything in aspect, let’s say like Venice, where the city is exactly the same extraordinary beauty as it was 500, 600 years ago. Any city that needs to adapt and change to new circumstances has to, in a way, adapt and change its DNA.
Let me take one example, the city that I live and work in: London. London has gone through different cycles. It went through the Industrial Revolution in the 19th century. It went through enormous growth and expansion in part of the 20th century. It had a significant downfall in the mid to late 20th century, the 1970s and 1980s, and now has picked up again in terms of population growth, activity, jobs and much else. The city has had to adapt, and it has also had to adapt its physical infrastructure; so, you have places like the financial core, the downtown of London itself, which is, of course, a major contributor to the national economy. A small part, a square mile, contributes something like over 20% to the national GDP. In this tight little enclave of medieval streets, you have some of Europe’s tallest skyscrapers, but the way they actually come to the ground is not that different to some of the buildings that were there 20, 30, 50, 100 years ago.
Inequality, layers and colour maps
It’s very important when one tries to understand cities to understand the different layers of complexity – a bit like a brain scan or an MRI that takes different slices, photography, of different parts of the brain at different levels – because if you look at a city in terms of its urban form, you can understand its parks, streets and squares, but you can do exactly the same at the level of its social structure. There are many maps available now for the cities that we inhabit that show in one area where more deprived people live than in another colour or statistical base. There are many techniques available today, particularly through the use of GIS technology, which take social and economic statistics and show them literally in different colours: you may have some parts of the city in red, where people are more deprived, they live shorter lives and they are less educated.
On the other end of the scale, you might have in green people who live longer lives in the same city and have much better education and access to jobs and employment. Every city has a completely different pattern of social and economic distribution. Some cities are much more problematic than others in the way this inequality is actually spatialised.
Let’s take again examples from the United States: Chicago, Los Angeles and St. Louis. There, you have a complete distinction between often the north being affluent and the whole south of the city being deprived. If we go to cities in Europe, in London, the east side is more deprived and the west side and the edge is relatively affluent. Paris is exactly the other way around. It’s the centre which is relatively affluent and the edge is relatively deprived. If you then take another brain scan and look at ethnicity, you can begin to understand different forms of overlap between economic areas which do not provide opportunity and the concentration of people from different ethnic backgrounds. The words that are often used to describe this, unpleasant as they are, mean something to us.
We’re talking about ghettos, and there are cities around the world which have been ghettoised so that the difference between social groups is literally cast in stone. There are cities that have done positive things to try and alleviate those issues.
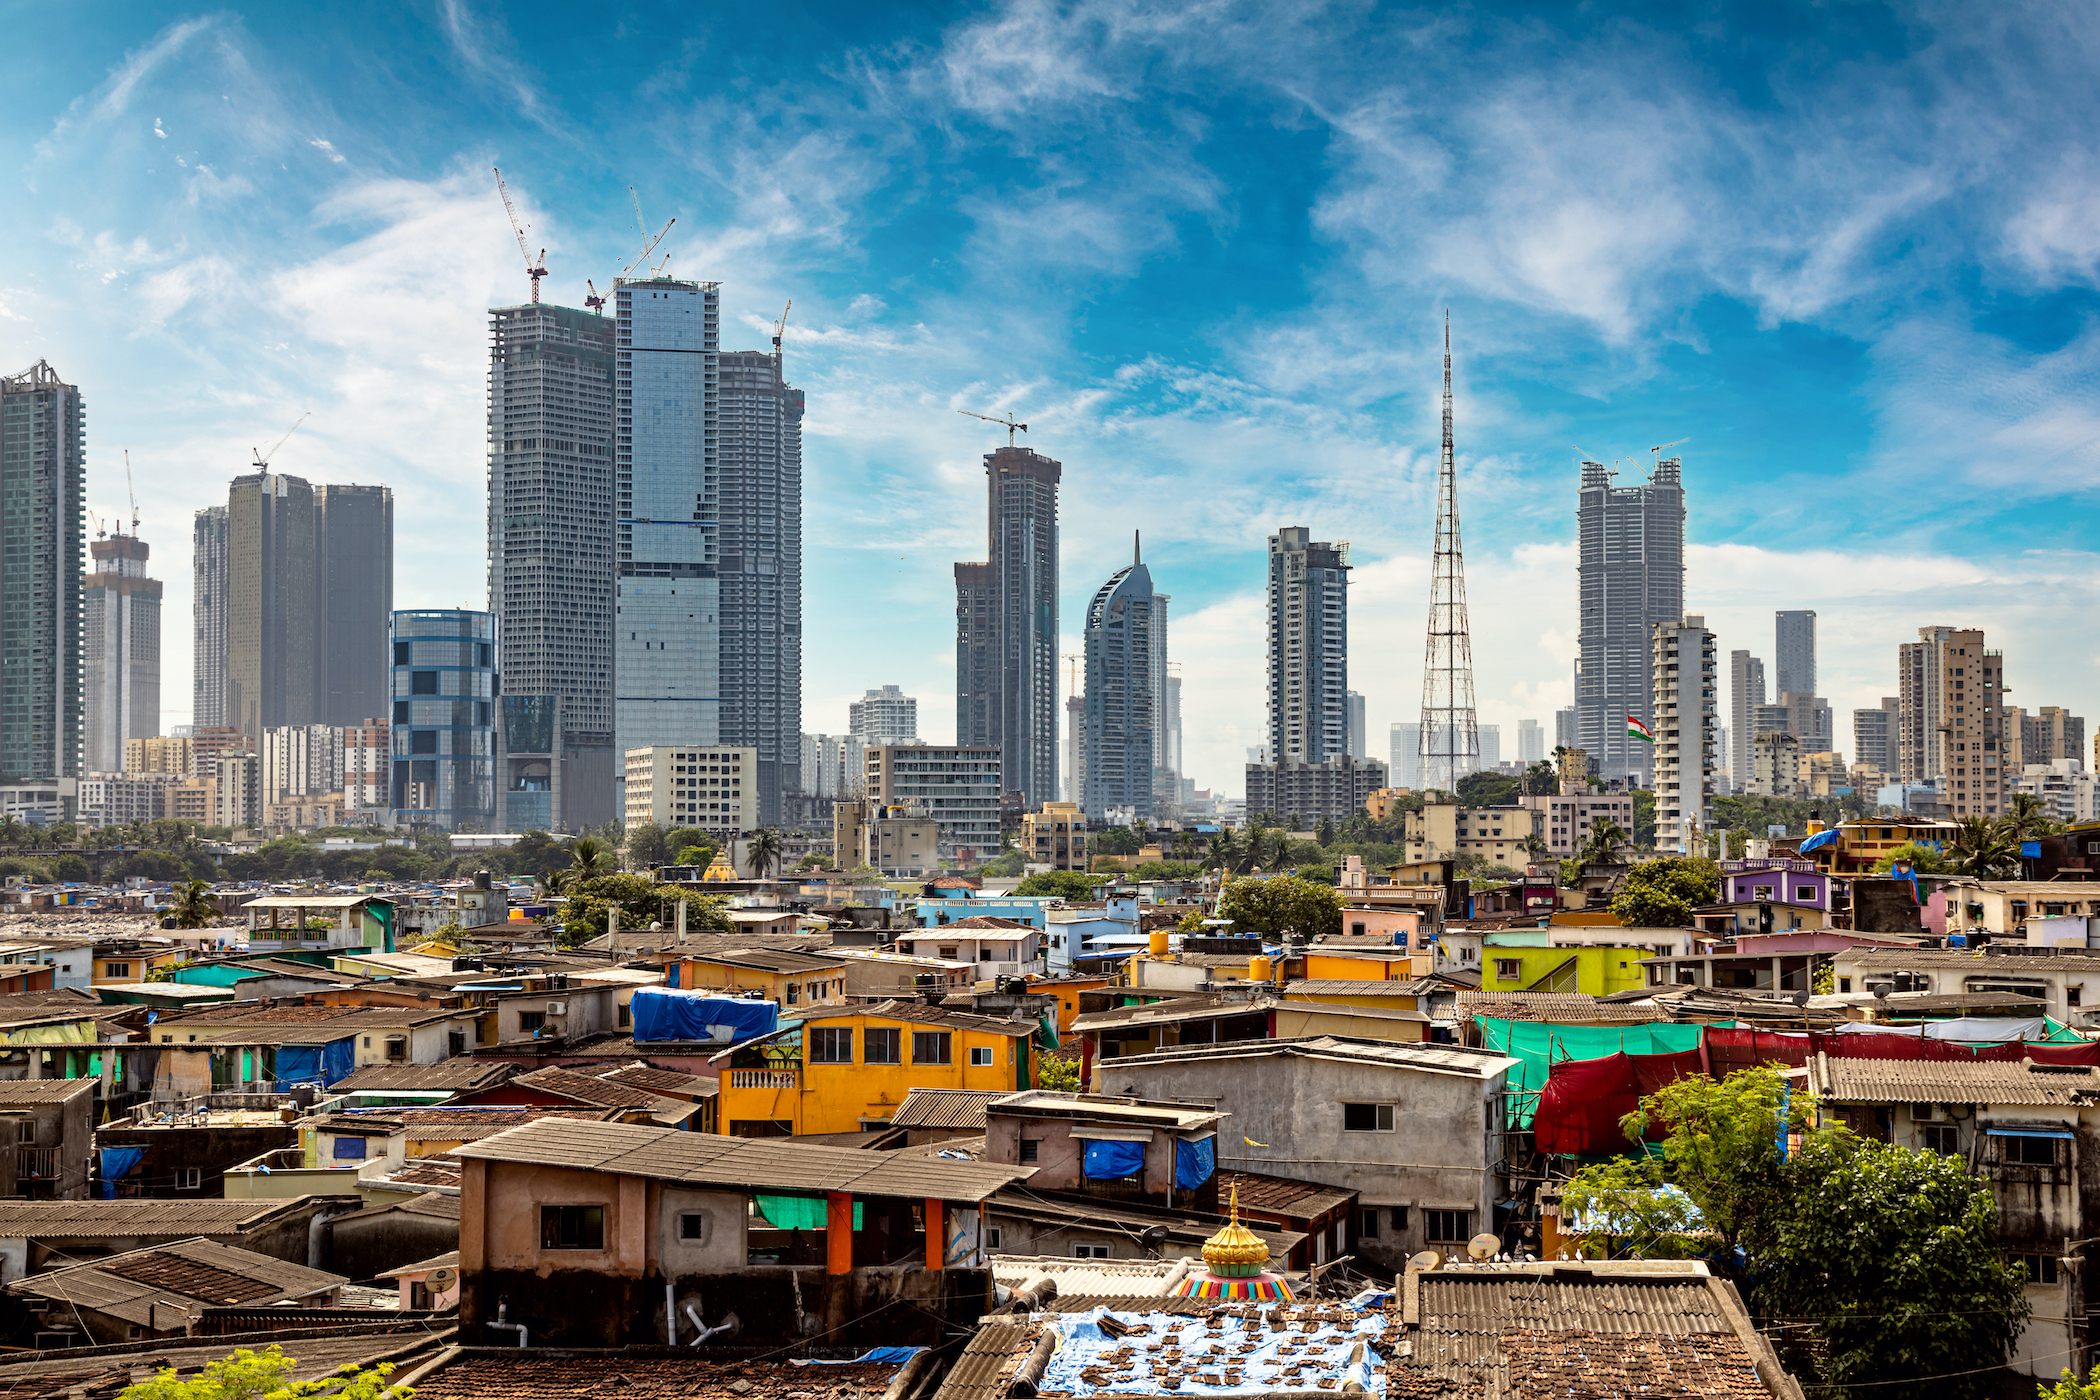
So, inequality is intrinsically related to both urban form and the way things are managed. When you come to informal development in Africa and Asia, that is where these concentrations of inequality could not be more spatialised, because whether you’re in Khayelitsha, in Cape Town, or in one of the largest informal settlements in Nairobi, in Africa, or in parts of Delhi, or in parts of Mumbai, which also have vast concentrations of informal settlements, you can actually see them from a satellite where they are concentrated and become forms of encampments. This doesn’t mean that they don’t have their own ecology, their own forms of social infrastructure. In fact, in the case of Mumbai, it’s well known that Dharavi, one of the oldest, most established informal settlements, has a very strong economy with small urban manufacturing jobs, and at some level is quite self-sustaining. However, the absence of basic things like toilets and sanitation, of course, makes life there really quite degrading, when it should not be the case.